


Unveiling the Climate Change Risk Assessment (CCRA) Process: Insights from Brazil’s Cities
Climate change poses an existential threat to cities worldwide, bringing challenges like rising temperatures, extreme weather events, and sea-level rise. With urban areas experiencing dense populations, climate risks pose a growing threat to major urban centers, understanding and mitigating these risks is essential for sustainable development and climate resilience.
Climate Change Risk Assessments (CCRAs) play a crucial role in identifying the vulnerabilities and risks that cities face due to climate change. By providing a systematic approach to assess these risks, CCRAs inform decision-making and enable tailored adaptation strategies (these are customized actions designed to address the unique climate risks and vulnerabilities of a specific city or region). This blog explores the methodology behind CCRAs, scalable tools being tested in Brazil, and how cities like Serra are using this framework to safeguard their future.
Case Study: Serra, Brazil
To illustrate the value of Climate Change Risk Assessments (CCRAs), we begin with a real-world example: Serra, Brazil. As part of our efforts to refine and validate our custom CCRA methodology, we conducted assessments for five pilot cities in Brazil, including Serra.
These assessments involved an in-depth analysis of climate hazards, exposure, and vulnerability using indicators derived from various data sources, ensuring a comprehensive and accurate evaluation of climate risks. The analysis incorporated climate hazard indicators such as drought and heatwaves from sources like AdaptaBrasil, exposure indicators such as population density from the Brazilian Institute of Geography and Statistics (IBGE), and vulnerability indicators such as income levels. Additionally, resilience was assessed through a questionnaire based on the UNDRR’s Disaster Resilience Scorecard for Cities, providing actionable insights into a city's preparedness to combat climate risks. This comprehensive approach allowed us to pinpoint the most pressing threats facing Serra and prioritize necessary adaptation strategies.
Key Findings for Serra
- Landslides: Serra faces a high risk of landslides, with urban infrastructure identified as the most vulnerable sector. Topography, land use, and precipitation patterns significantly contribute to this risk.
- Heatwaves: Rising temperatures heavily impact urban infrastructure, affecting transportation systems, energy networks, and public health services.
These findings underscore the need for tailored adaptation strategies to protect Serra’s critical infrastructure and enhance its resilience to climate change. Understanding how these risks are calculated is essential to applying CCRAs effectively.
What is a Climate Change Risk Assessment (CCRA)?
A CCRA is a structured evaluation of the potential vulnerabilities, impacts, and risks that climate change poses to urban systems(transportation networks like roads and railways, energy systems, water and sanitation services, buildings, public health services etc), sectors, and populations. The primary objective of a CCRA is to provide evidence-based insights that help cities prioritize adaptation measures and allocate resources efficiently.
The CCRA framework, as defined by the Intergovernmental Panel on Climate Change (IPCC), revolves around three key components:
- Hazards – Natural or human-induced events that pose threats (e.g., droughts, floods, heatwaves).
- Exposure – The presence of people, assets, or ecosystems that could be affected by hazards.
- Vulnerability – The susceptibility of systems or populations to the adverse impacts of climate hazards.
By analyzing these three components together, decision-makers gain critical insights into the risks their cities face. Specifically, CCRAs help decision-makers:
- Identify Priority Risks: By quantifying hazard, exposure, and vulnerability levels, CCRAs allow city officials to pinpoint the most pressing climate risks requiring immediate attention.
- Guide Resource Allocation: Decision-makers can strategically allocate financial and technical resources to high-risk areas, ensuring efficient investment in climate adaptation.
- Inform Policy Development: The findings from CCRAs can shape local climate action plans, zoning laws, building regulations, and emergency response strategies to mitigate identified risks.
- Strengthen Infrastructure Resilience: By understanding how infrastructure is impacted by climate risks, city planners can prioritize upgrades, retrofitting, and new developments that incorporate climate resilience.
- Support Community Engagement: CCRAs provide transparent data that can be used to engage communities, businesses, and stakeholders in resilience-building initiatives.
When combined, these dimensions help calculate a city’s overall risk, which serves as a guide for action. Action, in this context, refers to the proactive measures cities must take to reduce climate risk and enhance resilience. This includes:
- Implementing Early Warning Systems: Enabling communities to respond effectively to climate threats.
- Developing Climate-Resilient Infrastructure: Ensuring that roads, buildings, and utilities can withstand extreme weather events.
- Integrating Climate Considerations into Urban Planning: Adopting policies that restrict development in high-risk areas and encourage sustainable land use.
- Strengthening Emergency Preparedness: Enhancing response strategies to minimize the impact of climate disasters.
- Investing in Nature-Based Solutions: Leveraging green infrastructure such as wetlands, forests, and urban greenery to mitigate risks like flooding and heatwaves.
By translating CCRA insights into actionable strategies, cities can proactively safeguard their populations, economies, and ecosystems from the escalating impacts of climate change.
The Methodology: Breaking Down the CCRA Process
The Open Earth Foundation in collaboration with Brisa and I Care developed a CCRA tool which contains the CCRAs for over 5000 cities in Brazil. The development of city-specific climate risk profiles follows a custom methodology that assesses hazards, exposure, and vulnerabilities across multiple key impacts. The CCRA platform data infrastructure facilitates this process using the following methodology:
1. Key Impacts (Sectors)
Our methodology focuses on key sectors affected by climate change, including:
- Water resources
- Food security
- Energy Security
- Public health
- Biodiversity
- Infrastructure
- Road transportation
- Rail transportation
These sectors are analyzed for their exposure, vulnerability, and resilience to identified hazards.
2. Hazard Identification
Hazards such as drought, floods, sea-level rise, and heatwaves are identified using data from platforms like AdaptaBrasil; a platform that collects and integrates diverse data sources, including climate models, socio-economic data, and infrastructure information, to develop detailed indicators for vulnerability, exposure, and climate threats. These indicators are normalized, weighted, and aggregated to create composite risk indices, which are then classified into qualitative risk categories (Very Low to Very High) at municipal, state, and regional levels. For instance, drought indicators include the Standardized Precipitation Evapotranspiration Index (SPEI) and Maximum Consecutive Dry Days (CDD).
3. Vulnerability and Exposure Indicators
- Vulnerability: Socioeconomic factors such as income levels, population, age, and infrastructure quality determine how susceptible a city is to hazards.
- Exposure: The extent to which assets and populations are exposed to hazards, measured using indicators like population density and agricultural land use.
4. Calculating Risk
Risk is calculated using this formula:
RiskKey Impact, Hazard= Hazard Exposure Vulnerability
Each component is normalized and scaled to ensure consistency across cities and Key Impacts.
5. Resilience Adjustments
A qualitative resilience score is integrated into the risk calculation, adjusting for local adaptive capacity. The resilience questionnaire is based on the UNDRR’s Disaster Resilience Scorecard for Cities, providing actionable insights into a city’s readiness.
Figure 1 contains the structure of the risk assessment process flow.

Figure 1 — Structure of the risk assessment process flow
Data-Driven Insights and Tools
The CCRA tool integrates robust data from sources like AdaptaBrasil, IBGE, and IPS Brasil. This platform includes:
- Hazard Projections: Future scenarios (2030, 2050) for risks like droughts and floods.
- Indicator-Based Evaluation: Over 100 indicators tailored to each key impact and hazard.
- Scalability: A database schema designed to accommodate cities globally, ensuring replicability beyond Brazil.
Hazard, Exposure, and Vulnerability Indicators
Indicators are essential tools in Climate Change Risk Assessments (CCRAs), serving as metrics or proxies to quantify and evaluate the elements of risk. These indicators enable data-driven approaches to identify, prioritize, and address climate risks effectively.
For each key impact and hazard combination, indicators are carefully selected to ensure relevance and accuracy. This selection process, led by experts at I Care, integrates diverse data sources to provide meaningful insights. For example, the Maximum Consecutive Dry Days (CDD) indicator is used under the water resources key impact to measure drought conditions by determining the longest period without rainfall in a given year. You can explore a comprehensive list of these indicators here.
Construction of Hazard Indicators
Our methodology focuses on seven primary hazards—drought, floods, heatwaves, sea level rise, diseases, landslides, and wildfires. Hazard data is presented for both current conditions and future scenarios under IPCC pathways RCP 4.5 and RCP 8.5, covering projections up to 2030 and 2050.
Drought
- Standardized Precipitation Evapotranspiration Index (SPEI): This indicator assesses drought conditions by considering water balance, combining precipitation and temperature data. Lower SPEI values indicate severe droughts.
- Maximum Consecutive Dry Days (CDD): Measures the longest period of consecutive days without rainfall in a year. Lower CDD values suggest a higher likelihood of drought.
- These indicators are normalized (0-1 scale), weighted, and combined to create a drought hazard score.
Floods
- Maximum Precipitation in 5 Days (Rx5day): Measures the heaviest rainfall over five consecutive days in a year.
- Total Precipitation: Tracks annual precipitation with rainfall events exceeding the 95th percentile, signaling extreme precipitation.
- Flood Threat Index: Combines topography, land use, and meteorological data (e.g., Rx1day, Rx5day) to evaluate flood risks.
Heatwaves
- Maximum Temperature: Uses annual averages of maximum temperatures per municipality, comparing current data with historical reference values (1986–2005) to assess trends.
Landslides
- Landslide Threat Index: Incorporates topographic features (elevation, slope), soil characteristics, and meteorological indicators (e.g., Rx1day, Rx5day) to predict landslide risks.
Sea Level Rise
- Sea Level Change: Provides median projections of global and regional sea level rise based on IPCC AR6 data.
Diseases
- Mean Maximum Temperature: Higher temperatures influence the spread of vector-borne diseases.
- Relative Humidity: Critical for breeding and survival of disease vectors.
- Precipitation Intensity: Heavy rainfall creates stagnant water, a breeding ground for vectors such as mosquitoes.
Each of these hazard indicators is normalized and weighted to create a final hazard score, allowing cities to prioritize areas of concern.
Construction of Exposure and Vulnerability Indicators
Exposure and vulnerability indicators are tailored to specific key impacts and hazards. For example:
- Exposure: The population exposed to floods provides critical insights into potential public health impacts.
- Vulnerability: Indicators such as income levels and infrastructure quality highlight susceptibility to hazards.
These indicators are derived from diverse sources, normalized on a 0-1 scale, weighted, and summed to generate scores for exposure and vulnerability. However, while hazard indicators include future projections, exposure and vulnerability indicators are currently limited to present conditions. For a detailed list of these indicators, refer here.
Data Sources for Indicator Retrieval
A robust Climate Change Risk Assessment (CCRA) requires reliable and comprehensive data. The indicators used in our assessments are derived from a variety of trusted sources, ensuring accuracy and relevance across hazards, exposure, and vulnerability dimensions. Below are the primary data sources we utilized:
- AdaptaBrasil: Provides indicators for hazards and vulnerabilities, particularly climate-related risks.
- Brazilian Institute of Geography and Statistics (IBGE): Supplies critical exposure and vulnerability data, such as population density and socioeconomic metrics.
- IPS Brasil: Offers both vulnerability and exposure indicators tailored to various climate impacts.
- Agencia Nacional de Aguas (ANA): Focuses on water-related vulnerability indicators.
- Empresa de Pesquisa Energética (EPE): Contributes exposure data related to energy infrastructure.
- Google Earth Engine: Provides geospatial vulnerability indicators for environmental and infrastructure analysis.
- World Database on Protected Areas (WDPA): Supplies exposure indicators related to protected ecosystems and biodiversity hotspots.
- DATASUS (Tecnologia da Informação a Serviço do SUS): Delivers vulnerability indicators for public health analysis.
- MapBiomas: Offers land-use and land-cover data for exposure analysis.
- Brazilian National System for Water and Sanitation Data (SNIS): Provides vulnerability indicators related to water and sanitation infrastructure.
- Brazil's National Agency for Waterway Transportation (ANTAQ): Contributes exposure indicators for transport and logistics infrastructure.
- Institute for Applied Economic Research (IPEA): Supplies socioeconomic vulnerability data.
- GloBio (GRIP Global Roads Database): Provides exposure data related to road networks and accessibility.
These diverse sources form the backbone of our CCRA methodology, enabling precise assessments and actionable insights for cities. By integrating data from multiple domains, we ensure a holistic understanding of climate risks and vulnerabilities.
The data model that stores the information

Risk Score Calculation Methodology
The calculation of risk in Climate Change Risk Assessments (CCRAs) is based on the following formula:

This equation integrates three key components—Hazard, Exposure, and Vulnerability, each represented by indicators that quantify their respective contributions to risk. Since these indicators originate from different scales, normalization ensures comparability and consistency in the calculations.
Normalization Methodology
To standardize the indicators, we employ a multi-step normalization process:
- Identifying Outliers:
Scores are adjusted within the 0.05 to 0.95 percentile range to eliminate extreme values and align them within lower (LB) and upper bounds (UB):

- Min-Max Scaling:
The adjusted scores are scaled to a range of 0 to 1:

- Rescaling for Extreme Values:
To avoid extremes of 0 or 1, scores are further adjusted using the formula:
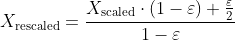
Here = 0.01 ensures that no score reaches absolute minimum or maximum values.
Graphical Representation of Normalization Methodology

Normalised Value = a/b =(city value - 5th percentile) / ( 95th percentile - 5th percentile)
Component Calculation
Once normalized, the values for Hazard, Exposure, and Vulnerability are calculated as the equally weighted average of their respective indicator scores:

Note: Indicators with a negative relationship to the component (e.g., lower income indicates higher vulnerability) are inverted using the transformation 1−i1 - i1−i.
Since risk is the product of three normalized values (Hazard, Exposure, and Vulnerability), the final risk scores are normalized again to maintain a consistent range between 0.01 and 0.99 across Key Impacts and hazards.
Resilience Score Calculation Methodology
Resilience is assessed using a qualitative questionnaire designed to measure a city’s preparedness and capacity to adapt to climate hazards. This questionnaire generates a percentage-based resilience score, which adjusts the vulnerability score as follows:
- Low resilience scores (below 0.5) increase vulnerability, reflecting a lower capacity to adapt.
- High resilience scores (above 0.5) decrease vulnerability, indicating stronger adaptive measures.
The adjusted vulnerability is calculated using the formula:

This adjusted vulnerability is then used to recalculate risk scores, ensuring that resilience factors are integrated into the overall risk assessment. Normalization is applied to maintain consistency across all calculated values.
This rigorous approach ensures that risk scores accurately reflect the interaction of hazards, exposure, and vulnerabilities, while accounting for resilience measures to provide actionable insights for adaptation planning.
Challenges and Opportunities
As cities grapple with the accelerating impacts of climate change, Climate Change Risk Assessments (CCRAs) serve as a crucial tool for identifying vulnerabilities and guiding adaptation strategies. However, the process of conducting CCRAs comes with both challenges and opportunities, shaping the way cities respond to climate threats and build resilience for the future.
Challenges
One significant challenge is the availability of future projections. While future data for hazards such as droughts, floods, and heatwaves is more readily accessible, similar projections for exposure and vulnerability indicators are far more difficult to obtain. As a result, future risk projections can only account for projected hazards, limiting a fully comprehensive view of future risks.
Scaling the methodology for CCRAs to cities in other countries introduces another layer of complexity. Each country has unique contexts and data sources for hazard, vulnerability, and exposure indicators. Identifying and validating these data sources can be time-intensive and requires a deep understanding of the local context to ensure accuracy and relevance.
Additionally, technical barriers, such as developing robust normalization rules for calculating risk and resilience scores, have been a key focus during the development of the CCRA tool. Striking a balance between methodological consistency and flexibility to adapt to diverse datasets remains a critical task.
Opportunities
Despite these challenges, the development of CCRAs presents numerous opportunities, some of those are as follows;
- Building Climate-Resilient Communities: By identifying risks early, cities can proactively design infrastructure and community programs that protect vulnerable populations from climate shocks.
- Informing Sustainable Development Goals (SDGs): CCRAs align with global sustainability objectives by promoting climate-adaptive planning and resilience-building efforts at the municipal level.
- Encouraging Technological Innovation: The need for better risk assessment tools has driven advancements in data modeling, artificial intelligence, and geospatial analytics, contributing to more effective climate decision-making.
- Empowering Future Generations: The integration of CCRAs into educational and policy frameworks ensures that future leaders, urban planners, and scientists are equipped to manage climate challenges proactively.
- Enhancing Economic Stability: Investing in resilience-building measures reduces long-term economic losses associated with climate disasters, benefiting both public and private sectors.
- Leveraging Collaboration for Global Impact: This initiative has leveraged the strength of collaboration. Partners such as C40 and I Care have brought invaluable expertise and insights, helping to overcome technical and methodological hurdles. This collaborative approach not only ensures the success of the CCRA tool but also paves the way for scalable and impactful climate adaptation solutions globally.
By harnessing these opportunities, CCRAs not only help cities prepare for climate-related risks but also contribute to a more sustainable and adaptive global future.
Applying the CCRA Process to Serra
Now that we have outlined the methodology, let’s return to our case study of Serra, Brazil to see how these calculations were applied in practice.
- Hazards Identified: Data from AdaptaBrasil helped identify landslides and heatwaves as primary threats.
- Exposure Analysis: High population density and critical infrastructure(road and rail road) exposure increased the city's overall risk.
- Vulnerability Assessment: Low adaptive capacity in urban planning and socio-economic factors heightened the impact of these hazards. This was assessed using the Social Vulnerability Urban Infrastructure Index which assesses how well cities are equipped to support their residents, particularly in response to climate risks and socio-economic challenges like housing, sanitation, waste management, electricity, health and education facilities among others.
- Risk Calculation: The combined factors produced a high overall risk score for landslides and heatwaves.
By applying this structured CCRA methodology, we provided actionable insights for Serra to develop strategies that enhance resilience and protect communities from climate-induced risks.
Call to Action
Climate risks are accelerating, and cities must act now to protect their people, assets, and ecosystems. The CCRA tool is a step forward in empowering cities with actionable insights and robust data for climate adaptation. By incorporating CCRA methodologies, cities can create proactive, data-driven frameworks to address climate change risks before they become catastrophic. These assessments not only help prioritize actions but also facilitate the allocation of resources to the areas most at risk. As cities around the world face increasingly complex climate challenges, the insights from Brazil’s pilot projects, including Serra, can serve as a model for other urban centers looking to strengthen their climate resilience. This approach enables cities to not only protect their infrastructure but also safeguard the well-being of their citizens, ensuring a more sustainable and secure future in the face of an uncertain climate.
If you’re a policymaker, urban planner, or climate advocate, consider leveraging CCRAs in your work. Explore our tool and join us in scaling this methodology globally. Together, we can build climate-resilient cities. Access our CCRA tool here
Learn more about the work we do at Open Earth Foundation


.png)


.jpg)


